Steady State Plot
1. Overview
The Steady State Plot feature enables users to visualise circuit‑level quantities such as terminal voltage, current, and charge as produced at the device contacts. These plots provide a clear view of how the device interacts electrically with its environment, making them essential for analysing I–V behaviour, operating points, and overall terminal characteristics.
2. Usage Instructions
- Ensure the required result file(s) are loaded. If the file you wish to use has not yet been loaded, click here for instructions on how to add result files.
- Click the
Steady State Plotbutton. This will open the plot view along with the associated settings panel. - Configure the plot settings. Within the settings panel, specify the details of the plot you wish to generate. See Quantities Available for Visualisation for detailed description of each value.
- Click the
Plotbutton to generate and display the selected data on the chart. - To include additional datasets, repeat Step 3 and then select
Add to Plot. The newly defined data will be overlaid onto the existing chart. - To export the plotted data for further analysis or reference, click the
Export Databutton. The data will be saved in a .csv file format. - Click the
Clear Plotbutton to remove all data from the chart.
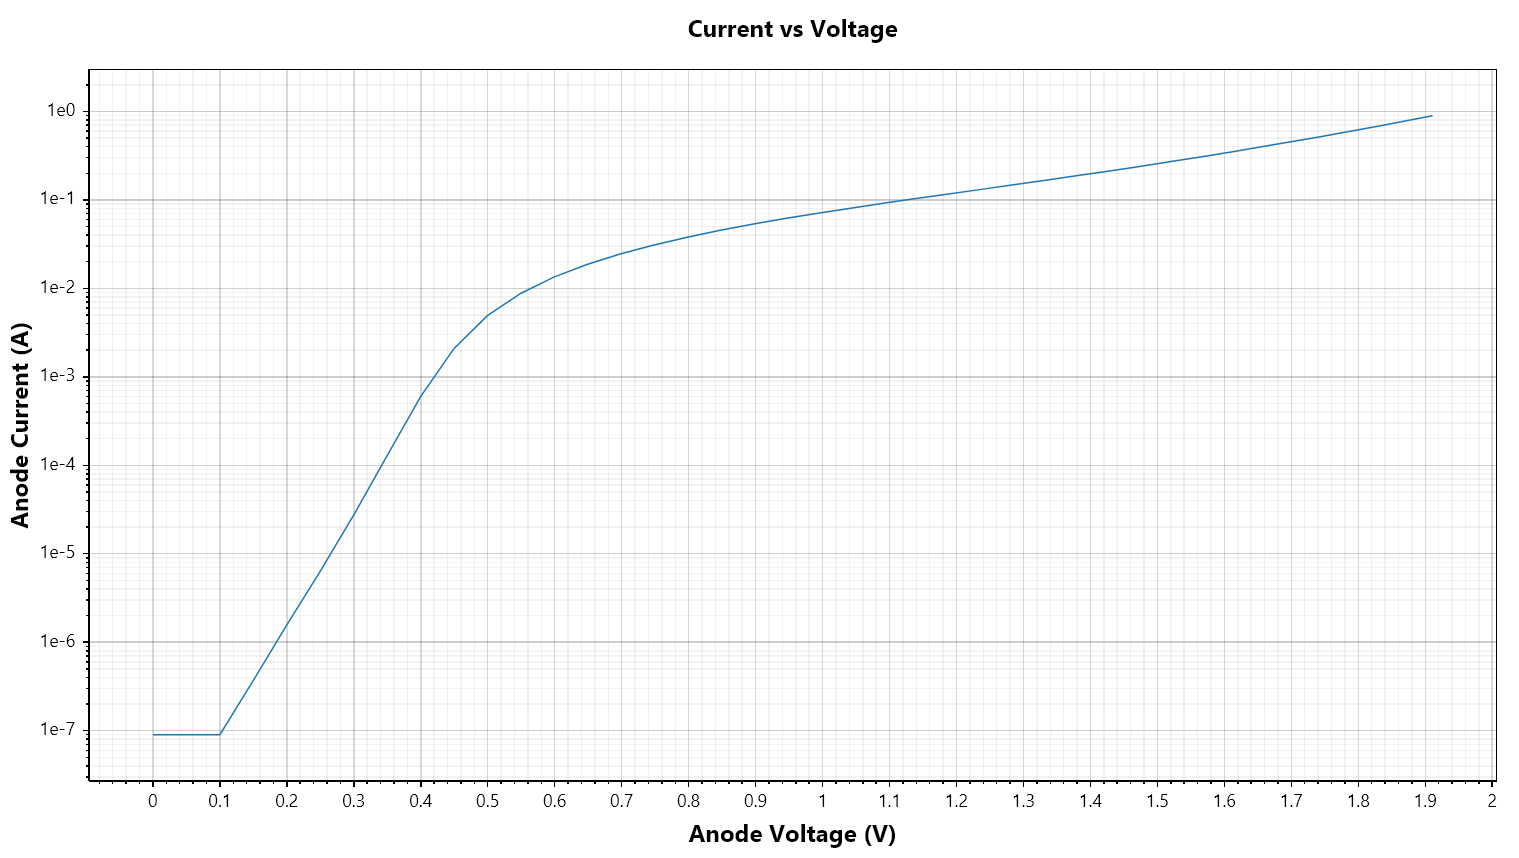
3. Parameters
In a Steady State Plot, the user can select either internal or external quantities to plot on the Y axis. The X axis is always an external quantity. The following parameters are available for configuration.
3.1. External Variable Type Parameters
| Name | Description | Unit |
|---|---|---|
File | The .res file to plot data from. | - |
X Axis Contact | The contact to use for the X axis data. | - |
X Axis Variable | Data to plot on the X axis. | - |
Y Axis Variable Type | The internal or external quantity use for y axis. | - |
Y Axis Contact | The contact to use for the y axis data. | - |
Y Axis Variable | External data to plot on the Y axis. | - |
Show Tick Marks | Show the points on the plot with a dot. | - |
Log Scaling | Use a logarithmic scale for the heat map. | - |
Min Value Threshold | The minimum value for the log scale. Useful for data that is 0 in parts of the device. | - |
3.2. Internal Variable Type Parameters
| Name | Description | Unit |
|---|---|---|
File | The .res file to plot data from. | - |
X Axis Contact | The contact to use for the X axis data. | - |
X Axis Variable | Data to plot on the X axis. | - |
Y Axis Variable Type | The internal or external quantity use for y axis. | - |
Y Axis Function | The mathematical function use for the y axis. | - |
Y Axis Variable | Internal data to plot on the Y axis. | - |
Include Oxide | Specifies whether oxide region(s) should be included in the plotted data. | - |
Show Tick Marks | Show the points on the plot with a dot. | - |
Log Scaling | Use a logarithmic scale for the heat map. | - |
Min Value Threshold | The minimum value for the log scale. Useful for data that is 0 in parts of the device. | - |
info
The Y Axis Function includes the statistical measures such as maximum, minimum, average and sum.